Top Post Views

3: Malaysia REITs - Looking For My 2nd Durian Runtuh
4: Is Insurance Really Necessary?
5: Everyone Must be A Millionaire

Head to the watch list on the above tab to see my what's on my radar and foreseeable future postings =)

Decided to make adjustments on the way I blog & share due to time constraints and other commitments. In the coming weeks you should see them. Short updates but more frequent & concise.

Tuesday, December 23, 2014

Aboi's Updates For January 2015

KLSE TECH REVIEW


Here's the link for my last month's market sense: Aboi's Updates for November 2014
For those who find it hard to follow I suggest reading through my previous posting on how I am using technical indicators as a trend seeker.
  1. First Attempt on Tech Analysis Part 1
  2. First Attempt on Tech Analysis Part 2

Recap - November's commentary. 

What a month it has been. Though I did foresee a small sell off due to technical signs of weakness - refer to last month's. But really nobody had it coming. The magnitude of the fall of the oil price triggered a massive outflow of foreign capital from our O&G counters and subsequently also lead to the weakening of the MYR. My support line of 1840 was easily breached in the month of November but the sell off looks like it has bottomed as Bursa is slowly recovering as of this post.

With oil expected to remain this low due to the supply glut with both American Shale oil producers and the Gulf producers not backing down production anytime soon. With MYR weakening, our inflationary pressures will worsen due to higher cost of imports. This is further compounded with GST coming in at 6% in April 2015. As inflation goes up, Bank Negara will only have two real options. [1] sell foreign reserves to support MYR [2] raise interest rates. The first option is only temporarily as we only have sufficient amount for 7.9 months of imports. The second will hit us hard as Malaysia's household debt to income ratio is already at a staggering 190%. NPL will surge and our banking system will weaken. Take Russia for example it raised interest rate from 11.5% to 17% in a single night to support its falling currency. 

Because I do not believe that 2015 will be a good financial year for Malaysia I will spend more of my efforts to diversify globally and will need to do it anyway due to the need for portfolio rebalancing. I will set a new resistance of 1810 and support line of 1700 for the month of January.

Key economic news and market update from AMP Capital's economic update (FoC, updated every Friday):
1. US Central Bank signalling low US interest rate will prevail until at least April 2015. 
2. Russia in full fledged economic crisis as Russian rubble (their currency) collapsed and interest rate was raised from 11.5% to 17% in December due to 40% fall in oil price and sanctions from US and Europe.
3. Shinzo Abe won re-election in Japan and has consolidated power by winning 2/3 of the lower house. He has vowed to redouble his efforts to kick start Japan's economy. Third arrow please.
4. US midterm elections. Republicans took over the House and the Senate. Will this mean more divided government because the president is a democrat? Likely so. Obama is heading to be a lame duck president for his remaining 2 years.


Portfolio -  minus 2.89% vs minus 5% KLSE Index
Again market sell off has hit my portfolio just after it recovered in November this time due to foreign capital outflows. Nevertheless I am adamant, as data suggests local institutions are supporting the market as of this post. Supermax was the hardest hit from rm2.35 to rm1.65 - backed by news that the CEO is charged for insider trading. Read more. Knee jerk reaction as Supermax is still business as usual. I will blog about this in January 2015.

My foreign investments are holding strong, providing crucial support when the local market was tanking as evident that my portfolio only lost 2.89% of its value vs KLSE index at 5%. As mentioned I further diversified when I placed an initial investment into a PRS fund. Private Retirement Schemes in Malaysia Part 2. I plan to triple my current exposure inside this fund in 2015. The shining metal - gold is stubbornly holding ground near $1200, still slightly above my target price. Continue to monitor and wait. 

I am waiting for my Dynaquest Stock Performance Guide Sept 2014 to arrive and I will restart my posts on stock analysis particularly Padini and MREITs.


PORTFOLIO REVIEW
Portfolio target composition. Equities 65%, Bonds 25% and Supplementary 10%.
Targets for returns p.a. Equities 12%, Bonds 5% and Supplementary 3.5%.


Notes
-Added CIMB-Principal PRS Plus Asia Pacific Ex Japan Fund (under Mutual Funds) with a BUY rating.

Comments
#1 Portfolio target for the fourth portfolio year @ RM140k for April 2014 has already EXCEEDEDPortfolio target for the fifth portfolio year @ RM152k for April 2015. The TWRR (time weighted annual return rate is now at 8.18% (down 0.98% from Nov'14vs my target of 9.40%).


Disclaimer: The reports, analysis and recommendations in this blog are solely my personal views. I do not link to any investment body or company. As such, I will not be responsible of any of your investment decision. Consult your investment adviser or come to your own conclusions before making any investment decision.

Wednesday, November 12, 2014

Private Retirement Schemes in Malaysia Part 2

March 2013: Private Retirement Schemes in Malaysia Part 1
After month of deliberations I have decided into putting some cash into Private Retirement Schemes, much better known as PRS. I will admit the biggest reason is the alluring PRS Youth Incentive. The other reason is that I am looking for investments outside Malaysia. Many already know I have exposure to Europe and US markets and now I want to increase my exposure to Asia exc Japan.


"In the 2014 Budget tabled on 25 October 2013, the Prime Minister had announced youth incentive of RM500 to contributors who participate in the PRS scheme to inculcate the importance of saving from an early age to ensure sufficient savings after retirement. The RM500 is a one-off contribution by the Government to young PRS members to encourage youth to undertake long-term savings for retirement through the PRS.
The Government will contribute RM500 per qualified person to be used to purchase units of PRS funds in the PRS account of youths, whom have accumulated a minimum gross contribution amount of RM1,000 within a year. This incentive will be made available for a period of 5 years from 2014 to 2018."

With the PRS Youth Incentive, a minimum of RM 1000 will essentially provide you a head start of 50% gain. Unfortunately it is only available to those aged 20 and above but have yet to reach the age of 31. The biggest winner would be the first time investors for they lack the experience and might be scared of losing capital from poor investment decisions. That 50% buffer is a huge advantage to begin with. Please DO NOT let it pass. 


What do you need?
[1] Provider’s joint account opening form cum transaction form. Initial subscription only for each provider. PRS Forms (not the full list of all fund houses)
[2] A copy of Malaysian NRIC or passport for foreigners. The front and back of the Malaysian NRIC must be on a single page.
[3] Additional RM10 for the opening of a PPA account for first-time PRS contributors.
**The above is via Fundsupermart platform (might be different if purchase directly). Fundsupermart offers 0% sales charge which is great.


Why did it take me more than a year to decide? 
First, to gauge the response of the scheme. - It has been lackluster. Part of the reason is its harsh penalties (RM25 fee and 8% tax) on withdrawal before retirement age (55 years old), another reason would be that the incentive caters to youths which very much lack any investment foresight and knowledge. Also the lack of track record makes it difficult for the experienced investors to decide.

Second, to see how the funds perform for at least the first year. Third, to examine what feeder funds they are feeding and their respective top holdings from their semi-annual/annual reports. Will talk about this below. **PRS has other exposure too (e.g. Malaysia/Fixed Income), unfortunately I will only cover funds with exposure to Asia exc Japan because that is what I am looking for.


Below are my observations back in March 2013. With more fund house entering the PRS since then, no.3 is no longer valid. The good news is no.1 and no.2 continues to meet expectations.

The below table will detail more:

Alpha: A +ve of 1.0 means the fund has outperform its benchmark index by 1.0%. The opposite goes for -ve.

Beta: A +ve of 1.2 means the fund is 20% more volatile than the index. The higher the beta suggest it offers the possibility of higher returns but also posing more risk. The opposite goes for -ve. 
R-squared: A higher R-squared will indicate a more useful beta value (85 to 100) aka good correlation. A low R-squared value means you should ignore the beta. It's a measure on well the fund is measured against an appropriate benchmark.
Standard deviationA large dispersion tells us how much the return on the fund is deviating from the expected normal returns.
Sharpe Ratio: The greater a portfolio's Sharpe ratio, the better its risk-adjusted performance has been. It describes how much excess return you get for extra volatility you endure in holding riskier asset.


Summary:
[1] I would disregard Public Mutual PRS funds due to their enormity (data not listed above). As of Nov 2014, its PRS Growth fund size is RM 91 million dwarfing even the closest rival Affin Hwang PRS Growth of RM 30 million. Its PRS Islamic Growth is RM 36 million beating its main competitor CIMB Islamic PRS Plus of RM 8 million.

[2] Manulife PRS have shown good performance for the 1st year but having the higher than average charges turns me off. They would have to prove themselves in the longer run since the funds feed on newly launched funds as well unlike the rest of the investment houses.

[3] AmPRS is doing so-so and its track record is overshadowed by Affin Hwang PRS Growth. Its Alpha values are weak and the Sharpe ratio is not good enough for the likes of a fund investing a majority of its capital into equities.

[4] AIA PRS is a recent new comer. I already have exposure in AIA funds via my ILP (insurance linked policy) so it would not be necessary for me to increase my holdings on the company.
Examining AIA's Investment-Linked Funds

[5] Both CIMB Principal PRS Plus AsPac Ex Jpn and Affin Hwang PRS Growth have good Sharpe ratio (with the former being better) with respect to their individual funds that they are feeding at. Affin's PRS Growth has slightly higher yearly charges so that would eat into some of your profits. Having said so Affin's PRS Growth is way more diversified as its mandated exposure is 70% equity and 30% fixed income so it's a less volatile fund (lower risk).


Conclusion:
I could go on, talking about fund deployed strategies, scrutinizing top holdings, the fund house/manager and etc but that's overwhelming for most readers - you can still however email me. All the above is the simplest way to convey the reasoning of my decision to go with CIMB Principal PRS Plus AsPac Ex Jpn. You will see this in next month's Aboi's Portfolio update and shall be part of my bi-annual Mutual Fund updates (Jan & July).

If you can stomach high 'calculated & understood' risk for high returns go with CIMB Principal PRS Plus AsPac Ex Jpn (Risk Factor 9/10). If you are just taking your baby steps into the investing realm Affin Hwang PRS Growth (Risk Factor 7/10) is perhaps a safer choice.

This is very useful for you-> Aboi's Mutual Fund Table Lists Nov 2014. For best experience, download and open file using Microsoft Excel. Data compiled by me and updated every Jan and July.

Saturday, November 8, 2014

Let's Talk About The Shining Metal..Again

Precious Metal: Gold
Rating: UNDERPERFORM (KEEP IN VIEW)

Current Price: $1,179 (from $1,334)

Target price: $1,100 to $1,150 (unchanged)

Fundamentals: Long Term Outperform (5-year period)
Sentiment: Medium Term Bearish (6-month period)
Risk Level: High

**Outperform: Expected to do better than market return; has upside or cheap vs target price. Usually a buy call.
**Market perform: Expected to be on neutral, can be + - 3% to 5% either way; Usually a hold call.
**Underperform: Expected to do worse than market return; has downside or too expensive to buy vs target price. If fundamentals change a sell call.


I have talked about gold a couple of times. 

First was back in late 2012 -> http://aboiwealthpot.blogspot.com/2012/10/the-yellow-fever.html. This was when gold was at it's all time high of $1800 and I have warned the perils of holding gold.

"To the disbelieve of ordinary folks, gold is just like any commodity. IT DOES NOT GO UP ALL THE TIME."
"If you have gold now, it's time to review your holdings. If you are thinking about getting into gold, think twice and HARD. A few useful indicators to look out for. 
No 1. If the central banks of major economies start raising interest rates, it is tough for all investment classes which includes gold. Because there is little point in putting cash into the banks when interest rates are low, people will buy gold as a hedge against inflation.
No 2. If the US dollar has strengthened, decrease in gold prices will follow. This is because people use gold as a substitute/hedge for the world's reserve currency."

No 2 is happening now. No 1 at the current trend would only apply to the US economy where it is foreseeable that the Fed will raise interest rate as early as 2015.


Next I posted in late 2013 -> http://aboiwealthpot.blogspot.com/2013/12/a-fool-and-his-gold-are-soon-parted.html. This was when gold of $1250 was experiencing a sharp decline.

" increasing demand does NOT come from jewelry or technology (I consider this a stable form of demand) it is from financial investments (speculative/hedging form of demand)."
"Equities or stocks are by far the best indicator to look at. It does not correlate with gold prices. E.g. if US stocks fly high, gold prices would be the opposite OR if interest rates goes up, folks would rather invest in cash rather than gold."

The US stock market is at it's all time high now, higher than pre-crisis levels of the 2008/2009 financial crisis.


Lastly I posted in early 2014 -> http://aboiwealthpot.blogspot.com/2014/03/speaking-of-recent-gold-demand-trends.html. When gold of $1350 made a small comeback.

"The only major factor keeping gold supported now is the RETAIL INVESTOR, people like me and you but actually not really us la. Whose buying them? The Chinese and Indians especially!"
"Back by India's restriction to limit gold import in mid 2014 and China's appalling just released PMI index, gold is going to meet resistance in the $13xx range."

It is did meet substantial resistance and is now hovering below $1200.

Let's examine what is happening now @ <$1200:
[1] I put the normal retail investor as either buying jewellery or investment such as physical bar demand. Both are running out of fuel. Though there is no Q3'14 data yet, judging by the current price it is safe to assume the trend is resuming.
[2] India's new PM Modi wants the Indian people to use banking instruments and hold less gold and is making it one of his to-do list and with the restriction to limit gold import (that will last to 2015) is hurting retail demand in India.
[3] China's demand is waning as well. Could it be President Xi Jinping's massive anti corruption drive (which will continue for years to come) hurting demand for luxury good such as gold? 

[4] Strong US dollar and with the US Fed finally ending its QE3 program, it signals that it is almost time that they will start raising interest rates which will further boost demand for the greenback that will hurt gold. This is because holding the shining metal has no yield (it does not pay any interest).

[5] Also BoJ's (Bank of Japan) just announced an aggressive QE program of it's own. This will boost the stock market of Japan, fueling the flow of money into equities. The ECB (European Central Bank) might be mulling the same idea considering that Europe (except UK) is re-entering recession. Money has to flow from somewhere and it will come from commodities like gold. Again because holding commodities has no yield.
[6] Russia might be selling some gold reserves to meet financial demands due to suppressing oil prices (which contribute a lot to the state budget) & also sanctions from Western countries.


How to get gold's fair value?
The answer is I don't know. It is not like an equity where various financial ratios can be used for in modelling e.g. PEGGY or DCF. What I do is simply identifying trends on the macroeconomics level - understanding what is happening around the globe e.g. be it financial or political. This is pretty much similar to how I did for palm oil where I was invested in BSDREIT and gained a nice 65% profit for holding it for 3 years. 

Back to gold, my target price ($1100 to $1150) and support line ($1000) remains unchanged. Pre-crisis financial crisis 2008/2009 prices were slightly below $1000 and at $800 as seen in 2007 when central banks were selling gold but now they are buying . Furthermore 100 tonnes each quarter for 14 consecutive quarters since 2011. In the long-term Jewelry demand should recover (with Asia's rapidly rising middle class), Technology demand to remain flattish, Total bar and coin demand as a form of investment will continue to slug as long as the markets around the world remains healthy. A majority of central banks should continue to hold and increase gold reserves as global monetary backup because the world economy remains unpredictable if not messier.

Thus I am assuming that demand will normalize to 2008 levels ~3800 tonnes per year. At the height of the gold price it was 4700 tonnes. Now it is trending to be similar to 2013. ~4000 tonnes per year.

In order to determine if gold is a good investment, one must have a view of the economic environment. Gold is a good investment when traditional assets are unlikely to maintain your purchasing power. That is, they are likely to depreciate when priced in gold, because they are tied to a declining economy. We are in one of these periods today and have been so for the last 12 years.

When growth is strong you will do better in traditional investments. They are exposed to growth and will outperform inflation hedges in such a climate. A classic example of such an environment would be the 1980-2000 period. Are we likely to enter such an environment again in the future? The key is to know when this new cycle has begun.

Warren does not believe in gold because it cannot produce anything, it has no output unlike holding companies and securities that offer yield. However I treat gold mainly as a CRISIS HEDGE and use the extremely long term horizon, holding for 10 years and above. With so much liquidity (money) in the system, there is plenty of fear in markets these days. Fear that paper assets will depreciate, fear that governments would not be able to repay their debts, fear that markets will collapse and etc. One thing I'm sure there will always be a NEXT CRISIS.


How to buy (approved by Bank Negara) gold in Malaysia?
You will need a current or savings account with the bank that is selling gold.
You will need to buy a initial minimum of 20g. At current price have at least RM 3000.
Subsequent buys must be done in bulks of 5g each. E.g. 5g, 10g, 15g and etc.
You should have a minimum of 10g in your gold account to avoid the monthly charges. If you intend to sell almost all just close the account.
UOB bank offers the cheapest gold price that you can purchase in Malaysia.
http://goldaboutinvestment.com/malaysia-banks-gold-price


On a side note:
Below is the US house price index. Post-WW2 house prices went up and stayed the same due to one sole thing: Population boom and rising middle class. The same goes to Malaysia back in 1980s to 1999 pre Asian Financial crisis. We have past that era. In fact our total % of working person to population will peak in 2020 according to the world bank. 

The America has had 3 housing boom & bust while Malaysia has had 1 before. My point here is everything that goes up above the trend will go down eventual. It applies to stock market, gold, house prices, even my Lego pieces. The difference is in the time frame due to the liquidity of the transaction. Why does it takes years for house prices to correct? Because it is illiquid. In the stock market I only need 3 days to cash out, can you do that for your home? As such you will need to look at a longer horizon. A decade (10 years) is a good measure. Go figure....


Anyway, we all know that my warning is WRONG and Malaysia continues to enjoy excellent growth in the property market. Have a nice weekend, please attend property expo(s), they seem to be the rage nowadays.

Monday, November 3, 2014

Aboi's Updates For November 2014

KLSE TECH REVIEW

Here's the link for my last month's market sense: Aboi's Updates for October 2014

For those who find it hard to follow I suggest reading through my previous posting on how I am using technical indicators as a trend seeker.
  1. First Attempt on Tech Analysis Part 1
  2. First Attempt on Tech Analysis Part 2

Recap - October's commentary. 

" Bursa did breach my support 1 @ 1860 and thus I've moved it to 1840. I shall define trading sideways as in +2% to -2% of total index points to make it really measurable. The most forthcoming event would be the tabling of Budget 2015 on October 10th. Until then we wouldn't know the winners and losers of the economic sectors so expect it to trade sideways in the next 10 days." - What an spectacular month. Not only did Bursa breached any imaginable support line all the way to less than 1800, it also bounced back extremely quickly above my same support line of 1840. Now it is trading at 1854. This is largely due to the US market correction. I think it would be difficult for Bursa to hit 2000 by year's end, more likely 1900. Budget 2015 was disappointing. It lacks substance and destined to be the same old thing. Construction sector stands to gain again from the budget as it always does due to a slew of government initiated infrastructure projects. You may read more from my previous post: Budget 2015: Same Old ThingI will set a new resistance of 1875 and support line of 1840 for the month of November.

Key economic news and market update from AMP Capital's economic update (FoC, updated every Friday):
1. US Federal Reserve's long anticipated ending of its Quantitative Easing program (print money to buy bonds). 
2. This QE is being replaced by Japan where its Bank of Japan has announced a new EQ program of around ¥80 trillion annually. ECB will help fill the rest. 
3. US midterm elections is due in November, Republicans will likely increase their House majority and get a small minority in the Senate. Will this mean more divided government because the president is a democrat?
4. Reserve Bank of Australia will likely maintain the interest rate at 2.5% and not raise interest rates until 2015.


Portfolio - Marginal losses but recovering
The market correction has obviously hit my portfolio, nevertheless I did not perform any panic selling nor did I do any day trading. Holding on to fundamentals, the securities across all of my investments are recovering and almost back to pre-correction levels. In fact some holdings have been better - Supermax & Genting. Also worth mentioning is how quickly AmDynamic Bond is catching up as seen from the NAV returns (2.66% a month ago, it is now 3.38%). Thus I am changing it from a HOLD rating to BUY. You may read my response to questions from other readers: About Bonds - What? Buy, Sell or Hold?

In October I've taken a look into how to adjust my portfolio position. You may read about it in my previous post The Balancing Act. Due to BoJ's aggressive QE stimulus program, my remaining plans for 2014 would be to [1] possible purchase of gold commodity [2] small initial investment into a PRS fund (Asia Pacific exposure - non-Malaysia). I will blog about these within this month. I still have Padini, and MREITs analysis. I will try to accommodate.


PORTFOLIO REVIEW
Portfolio target composition. Equities 65%, Bonds 25% and Supplementary 10%.
Targets for returns p.a. Equities 12%, Bonds 5% and Supplementary 3.5%.

Notes
-Change AmDynamic Bond from HOLD to BUY.

Comments
#1 Portfolio target for the fourth portfolio year @ RM140k for April 2014 has already EXCEEDEDPortfolio target for the fifth portfolio year @ RM152k for April 2015. The TWRR (time weighted annual return rate is now at 9.16% (down 0.34% from Oct'14vs my target of 9.40%).


Disclaimer: The reports, analysis and recommendations in this blog are solely my personal views. I do not link to any investment body or company. As such, I will not be responsible of any of your investment decision. Consult your investment adviser or come to your own conclusions before making any investment decision.

Wednesday, October 29, 2014

Budget 2015: Same Old Thing

Data sources: EPF's annual reports (KWSP), Ministry of Finance (MoF), Bank Negara Malaysia (BNM) and Auditor's General Report and Economic Planning Unit (EPU).

You may refer to my compiled sources here: Malaysian National Budget via Dropbox
No need to drill down the budget details - it's the same old thing. Only a few charts will do.

Spending more than we earn for a new record of 16 years in a row.


Hence we have been running fiscal deficits since the financial crisis of 1999.


Increased spending comes from ballooning operating expenditure. E.g. reckless handouts/promises of bonuses and etc. Development is sorely lagging behind.


Operating expenditure has now hit another new record high of 82% of our national budget allocation. Development expenditure is being squeezed hard. During Dr.M's time it was around 30s, PakLah's around 20s and now under Jib Goh it's 10s.


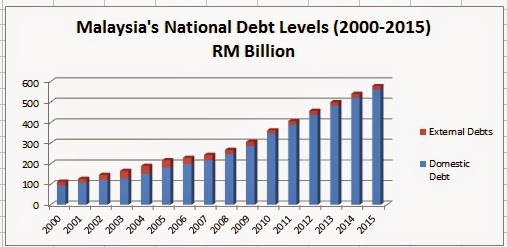
Persistent fiscal deficits are adding more and more to our total national debt further burdening future generations with ballooning national debt.


The country's national debt (domestic debt + foreign debt) is just short of its self-imposed ceiling of 55%. Very short = 0.02%.

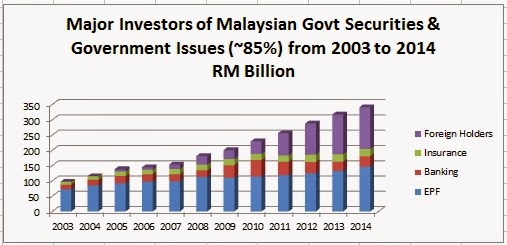
Nearly 30% of the national debt is held by the EPF and another 25% by foreign holders.

Contrary to the opposition party's opinion, I'm not worried about our debt to GDP ratio. This is because our debts are mainly domestic similar to Japan where its debt is 250% of GDP now although the high amount of foreign holders will leave our country's capital market more vulnerable to a sudden reversal of cross-border funds. However what is seriously more damaging is our persistently falling development/revenue ratio. Remember we are running deficits, if we minus out the deficit amount - almost every RM in the budget is used for operating expenditure only! Imagine this. You are earning RM 8,200. You have home utility bills of RM 8,200 and you got to pay them in full. You borrow RM 1,800 and that RM 1,800 is used to improve your livelihood. Seriously what a way to run the country. Bila nak bangun?

Monday, October 27, 2014

About Bonds - What? Buy, Sell or Hold?


I have been asked - What is a bond?
A financial instrument. More specifically it is a loan of money to either a company or government in return for a promise (not a guarantee because it can default) to pay you (the lender) a given rate of interest for a fixed period of time. e.g. usually measured in years (2 years, 5 years...maybe 10, 20 or even 30). This interest rate is often called the coupon rate while the date at which the issuer has to repay you the amount borrowed is called maturity date. 

Say you buy a bond from an issuer (say the government, in Malaysia it is called Malaysian Government Securities or MGS) with a face value of RM1000, a coupon of 4% and a maturity of 10 years. This simply means you'll receive a total of RM40 (RM1000*4%) of interest per year for the next 10 years. When the bond matures after 10 years, you will get your RM1000 back.

What most people don't know is that bonds are safer than equities (stocks/shares) ownership. A good example is when an issuer is a corporate one. A bond holder has higher claim on assets than shareholders do: that is, in the case of bankruptcy, a bondholder will get paid before a shareholder. However, the bondholder does not share in the profits if a company does well - he or she is entitled only to the principal plus interest. Therefore there is less risk in owning bonds than owning stocks but that comes at the cost of lower returns. 

Lastly the most confusing thing about bond is the price fluctuation which sets it apart from fixed deposit (the simplest form of financial instrument). The price fluctuate because bonds are publicly traded just like shares. When you buy the bond at par price (say RM1000), yield is equal to the coupon rate (interest), both at 4%. But if the price goes down to RM800, then the yield goes up to 5%. This happens because you are getting the same promised RM40 on an asset that is worth RM800 (RM40/RM800). Conversely, if the bond goes up in price to RM1200, the yield shrinks to 3.33% (RM40/RM1200).

In summary, if you are a bond buyer, you want high yields. This means buying bonds at a cheaper price. On the other hand, if you already own a bond, you've locked in your coupon rate (interest), so you hope the price of the bond goes up. This way you can cash out by selling your bond in the future.


More recently I have been questioned on my purchase timing of AmDynamic Bond as it is dishing out below expected historical returns.
First. What I want from bonds is at the bare minimum able to provide a return similar to a fixed deposit although the risk is higher. Bear in mind this is the 'bare minimum' and not the expected return which should always be slightly higher for the risk I'm taking. So far it has given me 3.28% year-to-year (since purchase) which is not far from a fixed deposit rate a year ago.

Second. The bond is meant to stabilize the overall portfolio. A bond can be compared to a defensive equity holding where the price will move up and down but you will get income along the way in the form of interest (in the comparison of equities from dividends). The bonds can do this kind of job (provide stability) if you own them and own them for the long term.

Third. Buying bonds in a potential rising interest rate environment is NOT counter productive towards returns. Rising rates push bond yields up and prices down. Longer-term bonds are generally more sensitive to rate hikes than shorter-term securities so holding short term ones are generally safer. Certain bond markets do well in this type of scenario. Higher yielding bonds and their fatter payout cushions the blow from rising rates while credit spreads should tighten as the economy gradually improves. Investors can have greater confidence in high-yield securities since a healthier global economy lowers the risk that such a marginal borrower will default. Once rate increases begin, bond investors have proven counterweights at their disposal and the most effective strategy may be to hold bonds or bond funds with staggered maturities, a tactic known as 'laddering'. A good fund house e.g. AmDynamic would employ such tactics as mentioned above.

I have said before and many times->Historical performance cannot be used as a perfectly accurate predictor towards future returns. Use it merely as a guide and reference.

***************************************************************
My five rules of choosing funds:
#1 Avoid choosing big sized popular funds!
#2 Compare fund expenses!
#3 Information on the fund manager!
#4 Good funds don't advertise.
#5 Avoid the usual past performance > riskiness of fund > manager's rep (some don't) > fund expenses > popularity of fund.  Look from the opposite direction and do your filtering from there.

Tuesday, October 14, 2014

Aboi's Updates For Malaysian Equities Mutual Funds for 2H'2014


Equities


TER is the total expense ratio, a measure of total cost (purchase, redemption, auditing, management fees) of a fund to the investor. The lower the better.

Commentary
[1] 4/5 of picks since 2012/2013 in four broad categories have since performed admirably: Kenanga Growth, Select Opportunity, Eastspring Small-cap and HL Consumer.
[2] I have added Affin Hwang Select Asia Quantum in which I will explain later over Eastspring's Small-cap fund as a better choice.
[3] The sole under performer is Public's Far East Property & Resorts (Property - indirect Asia fund) which has been performing flattish for almost two full years and thus under flagged. The fund is invested primarily in Asia emerging and developed markets e.g. Malaysia, South Korea, Indonesia. The performance is similar to PB Asia Real Estate Income fund (from Mixed Assets). Under flagged.
[4] As of this writing, I own Kenanga Growth Fund which has been performing above my expectation. Though it has recently changed fund manager in 2013, the fund is still up to par and I will be closely watching. 

[5] Even though Philip Master Equity Growth is top I shun it for the sole reason that the TER (total expense ratio) is a whopping 4%!.
[6] I also own Aberdeen Islamic World Equity Fund. This fund is only 1.5 years old and there is really no useful data to show. In due time I will share of course.
You may read why. 
Aberdeen Funds in Malaysia..Are They "Iron" Clad Investments?
Aboi To Finally Invest In Aberdeen Islamic World Equity Fund


Here's risk-adjusted returns measure using the five principles of risk measures; alpha, beta, r-squared, std deviation and Sharpe ratio. I will just explain what they represent rather than showing hefty equations.

Alpha: A +ve of 1.0 means the fund has outperform its benchmark index by 1.0%. The opposite goes for -ve.
Beta: A +ve of 1.2 means the fund is 20% more volatile than the index. The higher the beta suggest it offers the possibility of higher returns but also posing more risk. The opposite goes for -ve. 
R-squared: A higher R-squared will indicate a more useful beta value (85 to 100) aka good correlation. A low R-squared value means you should ignore the beta. It's a measure on well the fund is measured against an appropriate benchmark.
Standard deviationA large dispersion tells us how much the return on the fund is deviating from the expected normal returns.
Sharpe Ratio: The greater a portfolio's Sharpe ratio, the better its risk-adjusted performance has been. It describes how much excess return you get for extra volatility you endure in holding riskier asset.


Source: MorningStar - Rating & Risks section for respective fund
Immediately you will notice why I prefer Affin Hwang's Quantum over Eastspring Investments Small-cap. Sharpe ratios are similar but with Quantum's std dev at almost half of Small-cap's - less volatility. This explains why the Preservation rating of Small-cap is at an appalling 2. Nevertheless both are in different categories and they do excel at what they do. However I cannot stomach such volatility and would certainly lean towards Quantum. Perhaps you can :)


Second. There are three outstanding performers - those with Sharpe ratios of 2.26 & 2.27. With R-squared values around 80, I can take into consideration the Alpha and Beta values. MY Focus has the highest Beta, an indication of 30% more volatile than the market so I wouldn't stomach that either. That leaves Kenanga Growth and Equity Income. Equity income is the clear winner - lower Beta and less Std Dev. Would I consider it? Yes. But I already have Kenanga Growth which comes really close to it and I do not wish to increase my exposure purely into Malaysia equities.

So what's next? Definitely times are getting hard as equities start to peak especially in America and bonds floating as interest rates are as low as it can be. Europe looks like it's entering a recession as Germany recorded minus GDP growth for a second consecutive quarter and France still stagnating. I would say Asia (exc Japan). Funds that have such focus (SIF and Quantum) might still do okay but don't expect sky high returns. Unfortunately the world is in a more tangled position than it was in 2008. The best would be to hold more cash and wait to accumulate.
   
***************************************************************
My five rules of choosing funds:
#1 Avoid choosing big sized popular funds!
#2 Compare fund expenses!
#3 Information on the fund manager!
#4 Good funds don't advertise.
#5 Avoid the usual past performance > riskiness of fund > manager's rep (some don't) > fund expenses > popularity of fund.  Look from the opposite direction and do your filtering from there.